

Get Access to 250+ Online Classes
Learn directly from the world’s top investors & entrepreneurs.
Get Started NowIn This Article
What is risk? Is it volatility, measured by standard deviation or beta?
Yes, but not exactly.
Volatility is the measurement of price fluctuations — how much an asset or portfolio of assets swings.
If stock ABC falls $5 on day 1, then gains $5 on both day 2 and day 3, a measurement of total volatility will show ABC swung by $10 in 3 days (from a low of -$5 to a high of +$5).
But it only fell one day out of three — wasn’t that the only day we really saw risk?
The Sortino Ratio answers that question in the affirmative.
What is the Sortino Ratio?
Instead of measuring total volatility, like the Sharpe Ratio, the Sortino Ratio differentiates between positive volatility and harmful volatility.
Positive volatility is unexpected, sharp upswings in asset price movement.
Harmful volatility, on the other hand, is unexpected, sharp downsings in asset price movement.
Advocates of the Sortino Ratio argue that positive volatility isn’t risk. To their point, aren’t we making investments in hopes our assets increase in value?
Why then, when that happens, should that be considered risk?
It shouldn’t be.
Thus, the Sortino Ratio was born.
Advantages of the Sortino Ratio
Because of its differentiation between positive and harmful volatility, the Sortino Ratio is a useful way for investors and portfolio managers to evaluate an investment’s return compared to its bad risk.
The quality of an investment should be determined by its returns given the level of risk undertaken to achieve those returns.
Since upside volatility is beneficial for investors it shouldn’t be included in risk calculations — only harmful volatility should be considered.
The Sortino Ratio boils down an investment’s returns given its level of bad risk — and boils it down into a single figure. From there, investors can use it to easily compare multiple investment options or fund managers’ performances.
Disadvantages of the Sortino Ratio
Like all ratios, the Sortino Ratio can’t tell you everything — it’s only a tool.
Plus, the ratio is only as good as its inputs.
Fund managers can cherry-pick data points, resulting in Sortinos which are inaccurate at best and intentionally misleading at worst.
Be careful when using the Sortino Ratio (or any ratio) without looking at a broad time period and using it in conjunction with other valuation techniques.
The Sortino Ratio cannot be your only tool for making investment decisions.
Sortino Ratio Formula
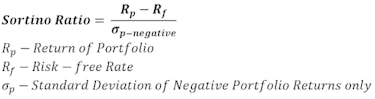
If this equation looks familiar to you, it should.
It’s the same as the Sharpe Ratio except only harmful (negative) volatility is included in the denominator.
What is a Good Sortino Ratio?
Just like the Sharpe Ratio, the higher the Sortino Ratio the better.
That’s the simple answer to the question “what is a good sortino ratio?”
When comparing two similar investments, investors will prefer the one with the higher Sortino Ratio.
The higher the figure, the greater the return per unit of harmful risk.
On a more complex note, a good Sortino Ratio is anything higher than 1.00, while anything above 2.00 is considered very good.
Ratios of 3.00 or higher are excellent — especially if sustained consistently.
What is a Poor Sortino Ratio?
A poor Sortino Ratio, on the other hand, is anything less than 1.00.
Any ratio in the 0 — 1.00 range should be considered suboptimal.
If you’re considering a fund or investment with a Sortino less than 1.00, you should move on — there are almost certainly better opportunities available.
Sortino Ratio Example
Next, we’ll take a look at an example of the Sortino Ratio.
Let’s assume Mutual Fund Z has an annualized return of 15% and a downside deviation of 10%. The risk-free rate is 2.5%.
- Mutual Fund Z has a Sortino Ratio of 15% - 2.5% / 10% = 1.25
Unlike the Sortino Ratio, the Sharpe ratio punishes for positive volatility.
Consider Mutual Funds X and Y. Each has an annualized return of 15%. X has a standard deviation of 12% and a downside deviation of 10%. Y has a standard deviation of 20% and a downside deviation of 5%. Again, we’ll use a risk-free rate of 2.5%.
- Mutual Fund X has a Sharpe Ratio of 15% - 2.5% / 12% = 1.04
- Mutual Fund Y has a Sharpe Ratio of 15% - 2.5% / 20% = 0.625
Using the Sharpe Ratio, X looks like the better fund. But, look at their Sortino Ratios:
- X has a Sortino Ratio of 15% - 2.5% / 10% = 1.25
- Y has a Sortino Ratio of 15% - 2.5% / 5% = 2.50
By this measurement, Y is the better fund. The Sortino method only focuses on the risk that matters — the real risk.
The Bottom Line: Sortino Ratio
The Sortino Ratio gets risk right.
Positive volatility is not risk.
If you buy a stock and it rises 10% in a day, you might wonder what the catalyst was, but you definitely won’t be disappointed.
Similarly, you won’t want to avoid the funds with similar price movements, which is exactly what will happen if you include positive volatility in your calculations.
The power of the Sortino Ratio is that it only tracks harmful volatility — real risk.
And that’s a power that you, as a stock investor, can utilize to make wise investment decisions.